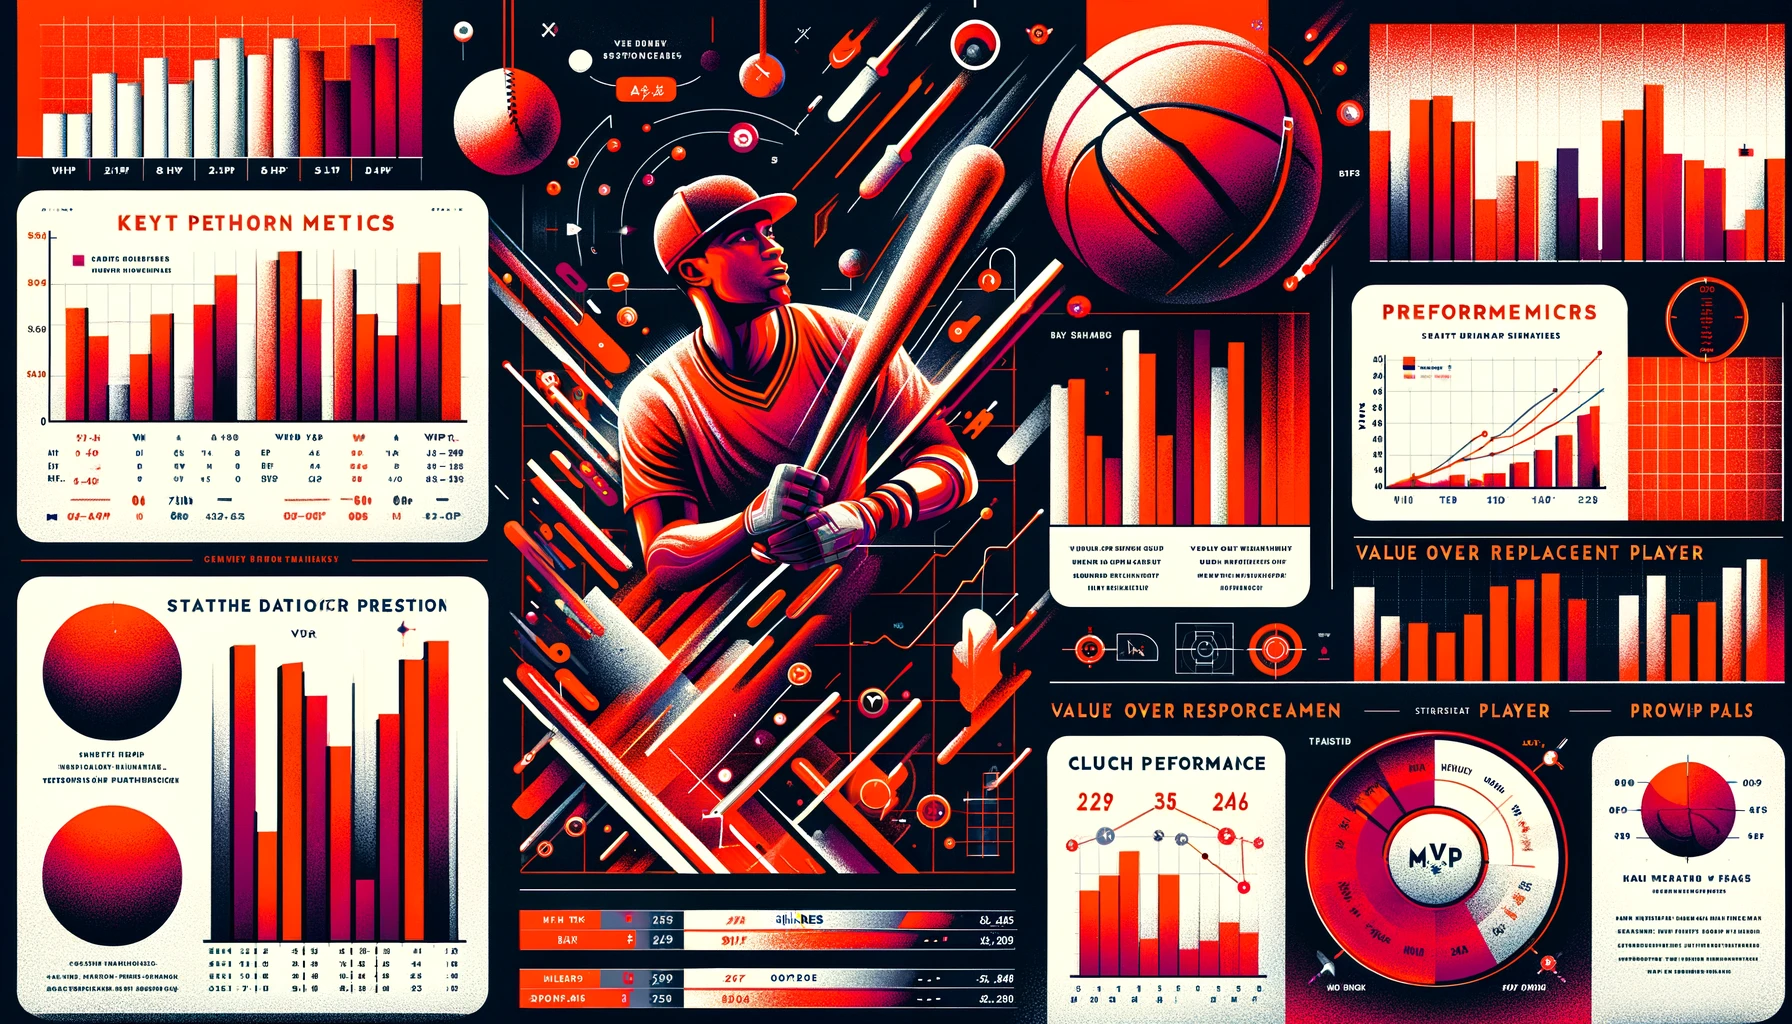
In the competitive realm of sports, identifying an MVP (Most Valuable Player) is more than just observing who scores the most points or runs the fastest. It’s about understanding a complex array of performance metrics that can predict the true value of a player to their team. This article explores the statistical tools and metrics that are most indicative of an MVP-worthy season across different sports.
Key Performance Metrics
Several statistics stand out when predicting potential MVPs:
- Points Per Game (PPG): In team sports like basketball and hockey, scoring is a straightforward metric of a player’s offensive impact.
- Win Shares (WS): This advanced metric estimates the number of wins a player produces for their team.
- Value Over Replacement Player (VORP): Commonly used in basketball and baseball, VORP measures a player’s contribution compared to a hypothetical replacement at the same position.
- Player Efficiency Rating (PER): PER sums up all a player’s positive accomplishments, subtracts the negative accomplishments, and returns a per-minute rating of a player’s performance.
Technology and Data Analysis
The integration of data analytics in sports has revolutionized how teams assess player value and performance. Sophisticated software and modeling tools allow analysts to predict MVP candidates by comparing current season performances against historical data of previous MVP winners.
Visualizing Data
The use of visual analytics plays a crucial role in interpreting complex data. Dynamic dashboards and interactive charts help teams and fans alike understand the nuances of sports analytics.

